> ## 09-3 반응형 웹 애플리케이션 만들기
>
> # Step 1 : 데이터 준비하기
>
> library(DT)
> library(ggplot2)
> head(mpg)
# A tibble: 6 x 11
manufacturer model displ year cyl trans drv cty hwy fl class
<chr> <chr> <dbl> <int> <int> <chr> <chr> <int> <int> <chr> <chr>
1 audi a4 1.8 1999 4 auto(l5) f 18 29 p compact
2 audi a4 1.8 1999 4 manual(m5) f 21 29 p compact
3 audi a4 2 2008 4 manual(m6) f 20 31 p compact
4 audi a4 2 2008 4 auto(av) f 21 30 p compact
5 audi a4 2.8 1999 6 auto(l5) f 16 26 p compact
6 audi a4 2.8 1999 6 manual(m5) f 18 26 p compact
>
> # Step 2 : 반응식 작성하기
>
> library(shiny)
>
> ui <- fluidPage(
+ sliderInput("range", "연비", min = 0, max = 35, value = c(0, 10)),
+ DT::dataTableOutput("table")
+ )
>
> server <- function(input, output, session) {
+ cty_sel <- reactive({
+ cty_sel <- subset(mpg, cty >= input$range[1] & cty <= input$range[2])
+ return(cty_sel)
+ })
+
+ output$table <- DT::renderDataTable(cty_sel())
+ }
>
> shinyApp(ui, server)
Listening on http://127.0.0.1:5504

>
>
> ## 09-4 레이아웃 정하기
>
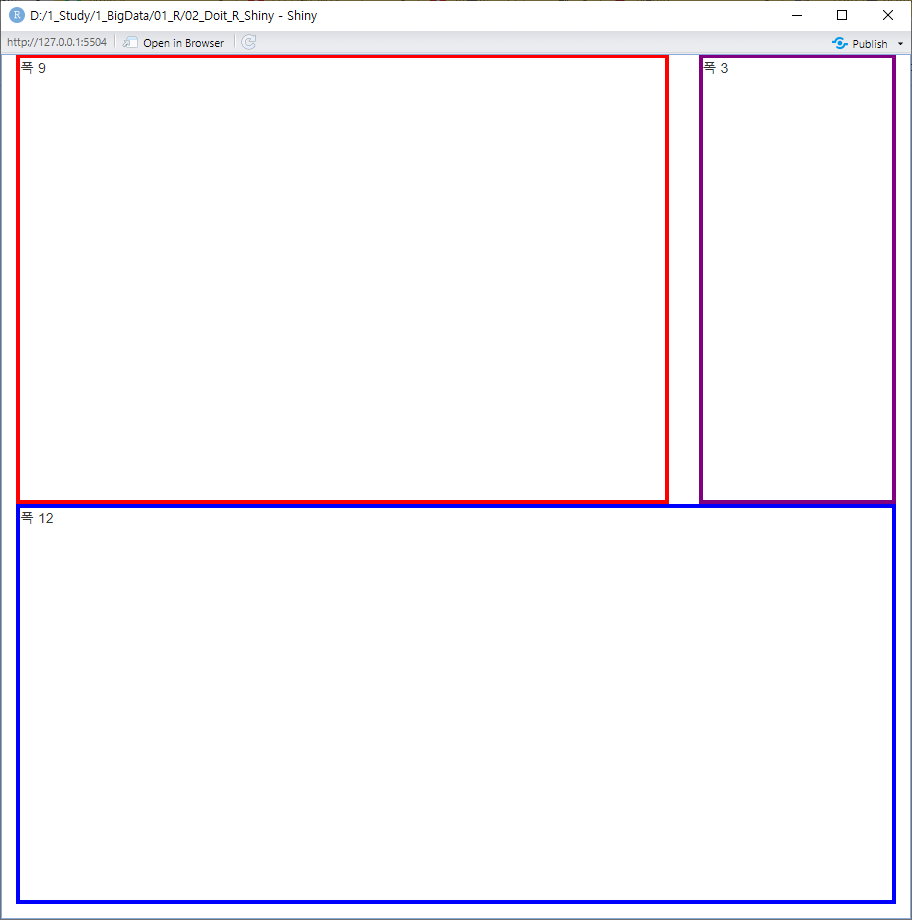
> # Step 1 : 단일 페이지 레이아웃
>
> library(shiny)
> ui <- fluidPage(
+ fluidRow(
+ column(9, div(style = "height:450px;border: 4px solid red;", "폭 9")),
+ column(3, div(style = "height:450px;border: 4px solid purple;", "폭 3")),
+ column(12, div(style = "height:400px;border: 4px solid blue;", "폭 12"))
+ )
+ )
> server <- function(input, output, session) {}
> shinyApp(ui, server)
Listening on http://127.0.0.1:5504
>
> # Step 2 : 탭 페이지 추가하기
>
> library(shiny)
> ui <- fluidPage(
+ fluidRow(
+ column(9, div(style = "height:450px;border: 4px solid red;", "폭 9")),
+ column(3, div(style = "height:450px;border: 4px solid purple;", "폭 3")),
+ tabsetPanel(
+ tabPanel("Tab1",
+ column(4, div(style = "height:300px;border: 4px solid red;", "폭 4")),
+ column(4, div(style = "height:300px;border: 4px solid red;", "폭 4")),
+ column(4, div(style = "height:300px;border: 4px solid red;", "폭 4"))
+ ),
+ tabPanel("Tab2",
+ div(style = "height:300px;border: 4px solid blue;", "폭 12")
+ )
+ )
+ )
+ )
> server <- function(input, output, session) {}
> shinyApp(ui, server)
Listening on http://127.0.0.1:5504


>
출처 : 김철민, ⌜공공데이터로 배우는 R 데이터분석 with 샤이니⌟, 이지스퍼블리싱, 2022
'데이터분석 > R' 카테고리의 다른 글
| [R 데이터분석 with 샤이니] 데이터 분석 어플리케이션 개발하기 2 - app.R (0) | 2022.07.23 |
|---|---|
| [R 데이터분석 with 샤이니] 데이터 분석 어플리케이션 개발하기 (0) | 2022.07.22 |
| [R 데이터분석 with 샤이니] 통계 분석과 시각화 (0) | 2022.07.12 |
| [R 데이터분석 with 샤이니] 분석 주제를 지도로 시각화하기 (0) | 2022.07.05 |
| [R 데이터분석 with 샤이니] 지오 데이터프레임 만들기 (0) | 2022.07.03 |


