[실무 프로젝트로 배우는...] 중고차 시세 확인 서비스 예측 분석
> ### 5.2 데이터 전처리
>
> #### 5.2.1 데이터 및 패키지 불러오기
>
> library(stringr)
> library(dplyr)
> library(ggplot2)
> library(ggsci)
>
> DIR = "F:/1_Study/1_BigData/12_R/02_Practical-R/Data/"
> List_Files = list.files(DIR)
> File_Length = length(List_Files)
>
> Total_Data = data.frame()
>
> for(k in 1:File_Length) {
+ if(!str_detect(str = List_Files[k], pattern = "unclean")) {
+ DF = read.csv(paste0(DIR, List_Files[k]))
+ DF$Brand = gsub(".csv","",List_Files[k])
+
+ Total_Data = Total_Data %>%
+ bind_rows(DF)
+ }
+ }
> # stringr 패키지의 str_detect() : 문자열 데이터에서 특정 문자열이 포함돼 있는지 판단하는 함수
>
>
> #### 5.2.2 데이터 전처리
>
> Total_Data$model = gsub(" ","",Total_Data$model)
> # model 변수 띄어쓰기 제거
>
> set.seed(1234)
> SL = sample(1:nrow(Total_Data), nrow(Total_Data) * 0.8, replace = FALSE)
> Total_Data_Train = Total_Data[SL,]
> Total_Data_Test = Total_Data[-SL,]
>
>
> ### 5.3 현재 시세 정보 서비스 구현
>
> Total_Summary = Total_Data_Train %>%
+ group_by(Brand, model, year) %>%
+ summarise(Min_price = min(price),
+ Mean_price = mean(price),
+ Max_price = max(price))
`summarise()` has grouped output by 'Brand', 'model'. You can override using the `.groups` argument.
> Total_Summary
# A tibble: 1,589 x 6
# Groups: Brand, model [197]
Brand model year Min_price Mean_price Max_price
<chr> <chr> <int> <int> <dbl> <int>
1 audi A1 2010 9990 9990 9990
2 audi A1 2011 6475 6475 6475
3 audi A1 2012 5990 8029. 10790
4 audi A1 2013 6299 8632. 11350
5 audi A1 2014 6490 10125. 15999
6 audi A1 2015 7490 11275. 15995
7 audi A1 2016 8295 12212. 19950
8 audi A1 2017 8490 13527. 22750
9 audi A1 2018 11872 15674. 19490
10 audi A1 2019 15600 21134. 26500
# ... with 1,579 more rows
>
> #### 5.3.1 서비스 구현을 위한 함수 정의
>
> # 브랜드 모델명 출력
>
> Model_Print = function(DF, B){
+ Brand_List = unique(DF$Brand)
+
+ if(B %in% Brand_List) {
+ DF2 = DF %>%
+ dplyr::filter(Brand == B)
+
+ print(unique(DF2$model))
+ } else {
+ print("브랜드명을 다시 입력하세요.")
+ }
+ }
>
> Model_Print(DF = Total_Summary, B = "audi")
[1] "A1" "A2" "A3" "A4" "A5" "A6" "A7" "A8" "Q2" "Q3" "Q5" "Q7" "Q8" "R8" "RS3" "RS4" "RS5" "RS6" "RS7" "S3"
[21] "S4" "S5" "S8" "SQ5" "SQ7" "TT"
> Model_Print(DF = Total_Summary, B = "audi2")
[1] "브랜드명을 다시 입력하세요."
>
> # 선택 조건에 따른 통계량 추출
>
> Summary_Extraction = function(DF, B, M, Y) {
+
+ Error = "N"
+
+ Summary_DATA = DF %>%
+ dplyr::filter(Brand == B) %>%
+ dplyr::filter(model == M) %>%
+ dplyr::filter(year == Y)
+
+ Summary_DATA2 = DF %>%
+ dplyr::filter(Brand == B) %>%
+ dplyr::filter(model == M) %>%
+ mutate(Group = "N")
+
+ Summary_DATA2$Group[Summary_DATA2$year == Y] = "Y"
+
+ if (nrow(Summary_DATA) == 0) {
+ Error = "E"
+ }
+
+ Result = list()
+ Result[['Summary_DATA']] = Summary_DATA
+ Result[['Summary_DATA2']] = Summary_DATA2
+ Result[['Error']] = Error
+
+ return(Result)
+
+ }
>
> Process1 = Summary_Extraction(DF = Total_Summary,
+ B = "audi",
+ M = "A1",
+ Y = 2019)
> Process1
$Summary_DATA
# A tibble: 1 x 6
# Groups: Brand, model [1]
Brand model year Min_price Mean_price Max_price
<chr> <chr> <int> <int> <dbl> <int>
1 audi A1 2019 15600 21134. 26500
$Summary_DATA2
# A tibble: 11 x 7
# Groups: Brand, model [1]
Brand model year Min_price Mean_price Max_price Group
<chr> <chr> <int> <int> <dbl> <int> <chr>
1 audi A1 2010 9990 9990 9990 N
2 audi A1 2011 6475 6475 6475 N
3 audi A1 2012 5990 8029. 10790 N
4 audi A1 2013 6299 8632. 11350 N
5 audi A1 2014 6490 10125. 15999 N
6 audi A1 2015 7490 11275. 15995 N
7 audi A1 2016 8295 12212. 19950 N
8 audi A1 2017 8490 13527. 22750 N
9 audi A1 2018 11872 15674. 19490 N
10 audi A1 2019 15600 21134. 26500 Y
11 audi A1 2020 18330 22868. 30950 N
$Error
[1] "N"
>
> Process1_2 = Summary_Extraction(DF = Total_Summary,
+ B = "audi",
+ M = "A1",
+ Y = 2021)
> Process1_2
$Summary_DATA
# A tibble: 0 x 6
# Groups: Brand, model [0]
# ... with 6 variables: Brand <chr>, model <chr>, year <int>, Min_price <int>, Mean_price <dbl>, Max_price <int>
$Summary_DATA2
# A tibble: 11 x 7
# Groups: Brand, model [1]
Brand model year Min_price Mean_price Max_price Group
<chr> <chr> <int> <int> <dbl> <int> <chr>
1 audi A1 2010 9990 9990 9990 N
2 audi A1 2011 6475 6475 6475 N
3 audi A1 2012 5990 8029. 10790 N
4 audi A1 2013 6299 8632. 11350 N
5 audi A1 2014 6490 10125. 15999 N
6 audi A1 2015 7490 11275. 15995 N
7 audi A1 2016 8295 12212. 19950 N
8 audi A1 2017 8490 13527. 22750 N
9 audi A1 2018 11872 15674. 19490 N
10 audi A1 2019 15600 21134. 26500 N
11 audi A1 2020 18330 22868. 30950 N
$Error
[1] "E"
>
> # 선택 조건에 따른 중고차 시세 정보 제공
>
> Information_Print = function(Process1) {
+
+ Error = Process1[["Error"]]
+ Summary_DATA = Process1[['Summary_DATA']]
+ Summary_DATA2 = Process1[['Summary_DATA2']]
+
+ if(Error == "N"){
+
+ print(paste0("브랜드(모델): ",
+ Summary_DATA$Brand,"(",Summary_DATA$model,")"))
+ print(paste0("연식: ",
+ Summary_DATA$year))
+ print(paste0("평균시세: ",
+ round(Summary_DATA$Mean_price,2)))
+ print(paste0("가격범위: ",
+ Summary_DATA$Min_price,"~",Summary_DATA$Max_price))
+
+
+ G = ggplot(Summary_DATA2) +
+ geom_errorbarh(aes(xmin = Min_price, xmax = Max_price, y = year,
+ col = Group),
+ alpha = 0.8) +
+ geom_point(aes(x = Mean_price, y = year, col = Group), size = 4) +
+ scale_color_nejm() +
+ scale_y_continuous(breaks = 2000:2030) +
+ ggtitle(paste0(Summary_DATA2$Brand[1],
+ "(model : ",Summary_DATA2$model[1],")")) +
+ theme_bw() +
+ theme(text = element_text(face = "bold", size = 14),
+ legend.position = "bottom") +
+ xlab("중고차 시세") + ylab("연식") +
+ guides(col = FALSE)
+
+ print(G)
+
+ }else{
+
+ print(paste0("브랜드(모델): ",
+ Summary_DATA2$Brand[1],"(",Summary_DATA2$model[1],")"))
+ print("연식: 정보없음")
+ print("평균시세: 정보없음")
+ print("가격범위: 정보없음")
+
+ G = ggplot(Summary_DATA2) +
+ geom_errorbarh(aes(xmin = Min_price, xmax = Max_price, y = year,
+ col = Group),
+ alpha = 0.8,height = 0.5) +
+ geom_point(aes(x = Mean_price, y = year, col = Group), size = 4) +
+ scale_color_nejm() +
+ scale_y_continuous(breaks = 2000:2030) +
+ ggtitle(paste0(Summary_DATA2$Brand[1],
+ "(model : ",Summary_DATA2$model[1],")")) +
+ theme_bw() +
+ theme(text = element_text(face = "bold", size = 14),
+ legend.position = "bottom") +
+ xlab("중고차 시세") + ylab("연식") +
+ guides(col = FALSE)
+
+ print(G)
+ }
+
+ }
>
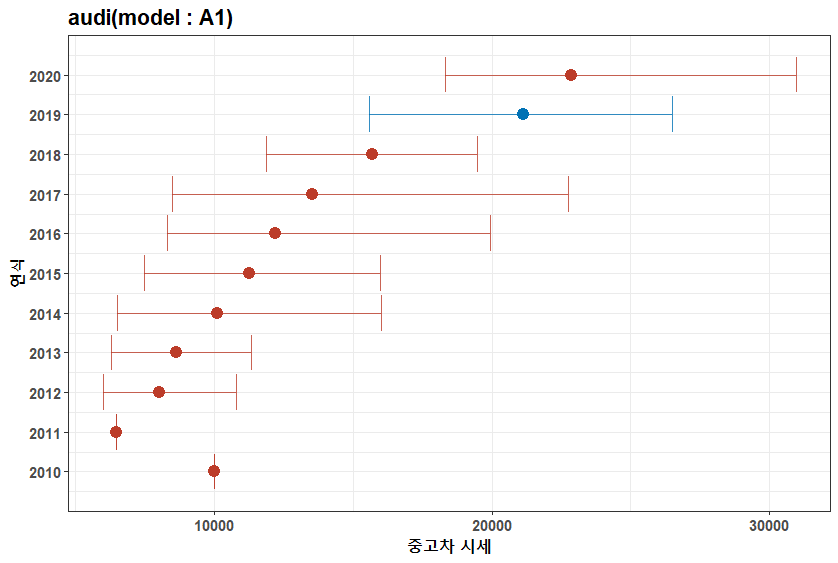
> Information_Print(Process1 = Process1)
[1] "브랜드(모델): audi(A1)"
[1] "연식: 2019"
[1] "평균시세: 21133.9"
[1] "가격범위: 15600~26500"
경고메시지(들):
`guides(<scale> = FALSE)` is deprecated. Please use `guides(<scale> = "none")` instead.
>
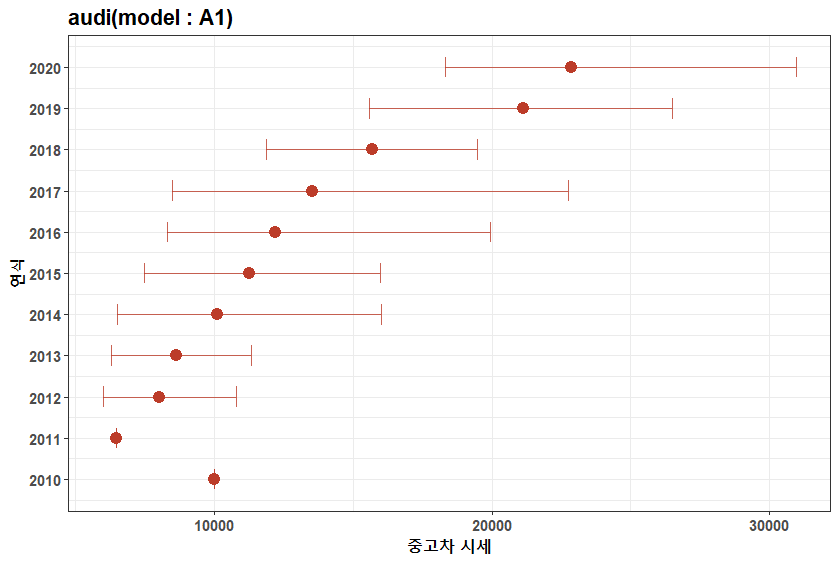
> Information_Print(Process1 = Process1_2)
[1] "브랜드(모델): audi(A1)"
[1] "연식: 정보없음"
[1] "평균시세: 정보없음"
[1] "가격범위: 정보없음"
경고메시지(들):
`guides(<scale> = FALSE)` is deprecated. Please use `guides(<scale> = "none")` instead.
>
>
> ### 5.4 신규 서비스 구현
>
> #### 5.4.1 신규 서비스 구현을 위한 함수 정의
>
> # 모델 학습
>
> library(mgcv)
>
> Regression_Modeling = function(DF){
+
+ Regression = list()
+
+ Group1 = DF %>%
+ dplyr::filter(!Brand %in% c("cclass","focus"))
+
+ Group1_BRAND = unique(Group1$Brand)
+
+ for(B in 1:length(Group1_BRAND)){
+
+ DF_Brand = Group1%>%
+ dplyr::filter(Brand == Group1_BRAND[B])
+
+ GAM = gam(log(price) ~ model + s(mileage) + mpg + engineSize + fuelType,
+ data = DF_Brand)
+
+ Regression[[paste0(Group1_BRAND[B])]] = GAM
+
+ }
+
+ Group2 = DF %>%
+ dplyr::filter(Brand %in% c("cclass","focus"))
+
+ Group2_BRAND = unique(Group2$Brand)
+
+ for(B in 1:length(Group2_BRAND)){
+
+ DF_Brand = Group2%>%
+ dplyr::filter(Brand == Group2_BRAND[B])
+
+ GAM = gam(log(price) ~ s(mileage) + engineSize + fuelType,
+ data = DF_Brand)
+
+ Regression[[paste0(Group2_BRAND[B])]] = GAM
+
+ }
+
+ return(Regression)
+
+ }
>
> Regression_list = Regression_Modeling(DF = Total_Data_Train)
>
> rsq_V = c()
> for(S in 1:length(Regression_list)){
+ sm = summary(Regression_list[[S]])
+ rsq = sm$r.sq
+ rsq_V[S] = rsq
+ }
>
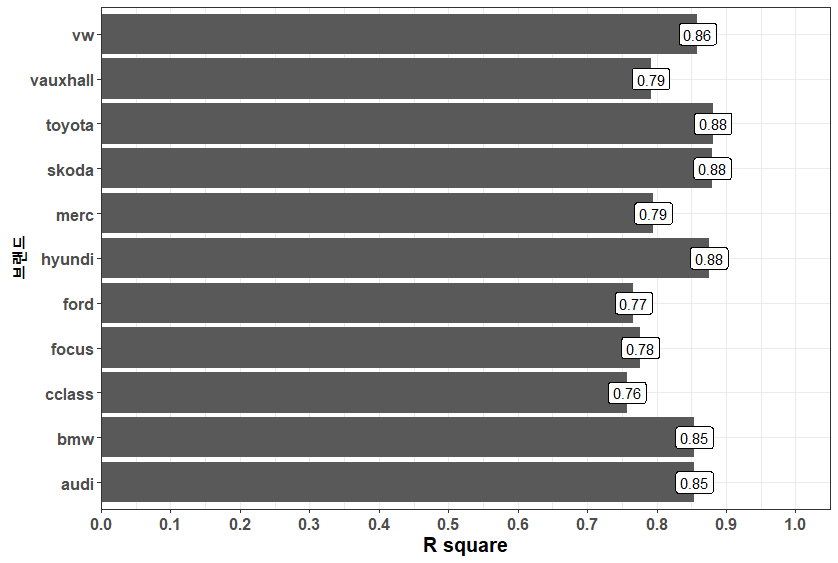
> # 모형별 성능 평가를 위한 간단한 시각화
> ggplot(NULL) +
+ geom_bar(aes(x = names(Regression_list), y = rsq_V), stat = 'identity') +
+ geom_label(aes(x = names(Regression_list), y = rsq_V, label = round(rsq_V,2))) +
+ xlab("브랜드") + ylab("R square") +
+ scale_y_continuous(breaks = seq(0,1, by = 0.1),
+ limits = c(0,1.05), expand = c(0,0)) +
+ theme_bw() +
+ theme(text = element_text(size = 15, face = "bold")) +
+ coord_flip()
>
> # 중고차 시세 예측
> Price_Prediction = function(Regression, New_DF){
+ Predicted_Price = predict(Regression[[New_DF$Brand[1]]], newdata = New_DF)
+ Predicted_Price = exp(Predicted_Price)
+
+ return(Predicted_Price)
+ }
>
> # 신규 서비스 화면 구성
> Information_Print2 = function(Process1, Predicted_price){
+
+ Error = Process1[["Error"]]
+ Summary_DATA = Process1[['Summary_DATA']]
+ Summary_DATA2 = Process1[['Summary_DATA2']]
+
+ if(Error == "N"){
+
+ print(paste0("브랜드(모델): ",
+ Summary_DATA$Brand,"(",Summary_DATA$model,")"))
+ print(paste0("연식: ",
+ Summary_DATA$year))
+ print(paste0("평균시세: ",
+ round(Summary_DATA$Mean_price,2)))
+ print(paste0("가격범위: ",
+ Summary_DATA$Min_price,"~",Summary_DATA$Max_price))
+ print(paste0("예측시세: ",
+ round(Predicted_price,2)))
+
+
+ G = ggplot() +
+ geom_errorbarh(data = Summary_DATA2,
+ aes(xmin = Min_price, xmax = Max_price, y = year,
+ col = Group),
+ alpha = 0.8) +
+ geom_point(data = Summary_DATA2,
+ aes(x = Mean_price, y = year, col = Group), size = 4) +
+ geom_point(aes(x = Predicted_price, y = Summary_DATA$year),
+ size = 4, col = "black") +
+ scale_color_nejm() +
+ scale_y_continuous(breaks = 2000:2030) +
+ ggtitle(paste0(Summary_DATA2$Brand[1],
+ "(model : ",Summary_DATA2$model[1],")")) +
+ theme_bw() +
+ theme(text = element_text(face = "bold", size = 14),
+ legend.position = "bottom") +
+ xlab("중고차 시세") + ylab("연식") +
+ guides(col = FALSE)
+
+ print(G)
+
+ }else{
+
+ print(paste0("브랜드(모델): ",
+ Summary_DATA2$Brand[1],"(",Summary_DATA2$model[1],")"))
+ print("연식: 정보없음")
+ print("평균시세: 정보없음")
+ print("가격범위: 정보없음")
+ print(paste0("예측시세: ",
+ round(Predicted_price,2)))
+
+ G = ggplot() +
+ geom_errorbarh(data = Summary_DATA2,
+ aes(xmin = Min_price, xmax = Max_price, y = year,
+ col = Group),
+ alpha = 0.8,height = 0.5) +
+ geom_point(data = Summary_DATA2,
+ aes(x = Mean_price, y = year, col = Group), size = 4) +
+ geom_point(aes(x = Predicted_price, y = Summary_DATA$year),
+ size = 4, col = "black") +
+ scale_color_nejm() +
+ scale_y_continuous(breaks = 2000:2030) +
+ ggtitle(paste0(Summary_DATA2$Brand[1],
+ "(model : ",Summary_DATA2$model[1],")")) +
+ theme_bw() +
+ theme(text = element_text(face = "bold", size = 14),
+ legend.position = "bottom") +
+ xlab("중고차 시세") + ylab("연식") +
+ guides(col = FALSE)
+
+ print(G)
+ }
+
+ }
>
>
> ### 5.5. 신규 서비스 테스트
>
> N_DF = Total_Data_Test[1,]
> N_DF$price
[1] 16800
>
> N_Process = Summary_Extraction(DF = Total_Summary,
+ B = N_DF$Brand[1],
+ M = N_DF$model[1],
+ Y = N_DF$year[1])
> Information_Print(Process1 = N_Process)
[1] "브랜드(모델): audi(A4)"
[1] "연식: 2017"
[1] "평균시세: 18189.07"
[1] "가격범위: 11500~31990"
경고메시지(들):
`guides(<scale> = FALSE)` is deprecated. Please use `guides(<scale> = "none")` instead.

>
> Predicted = Price_Prediction(Regression = Regression_list,
+ New_DF = N_DF)
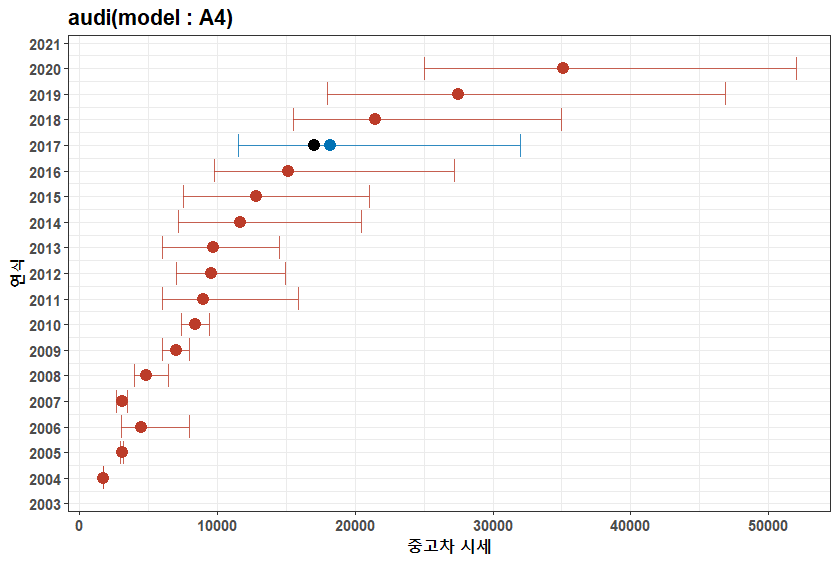
> Information_Print2(Process1 = N_Process, Predicted_price = Predicted)
[1] "브랜드(모델): audi(A4)"
[1] "연식: 2017"
[1] "평균시세: 18189.07"
[1] "가격범위: 11500~31990"
[1] "예측시세: 17029.41"
경고메시지(들):
`guides(<scale> = FALSE)` is deprecated. Please use `guides(<scale> = "none")` instead.
출처 : 실무 프로젝트로 배우는 데이터 분석 with R